gsdata: Interface to the GeoSphere Austria DataHub API (Data Access)

In 2019, GeoSphere Austria (formerly ZAMG) began offering public access to a wide variety of weather, climate, and environmental data. Most of this data is available under the Creative Commons Public Domain Dedication (CC0) license, making it free to use for any application.
The data can be retrieved through the
GeoSphere Austria Data Hub API,
and the gsdata R package provides a convenient interface to easily access
and process the data. Initially developed for personal use, this package may
require future updates or extensions.
The example below demonstrates a basic use case. For more information and additional examples, please refer to the documentation..
- Documentation: https://retostauffer.github.io/gsdata
- Repository: https://github.com/retostauffer/gsdata
- Issues and bug reports: https://github.com/retostauffer/gsdata/issues
Innsbruck weather data (example)
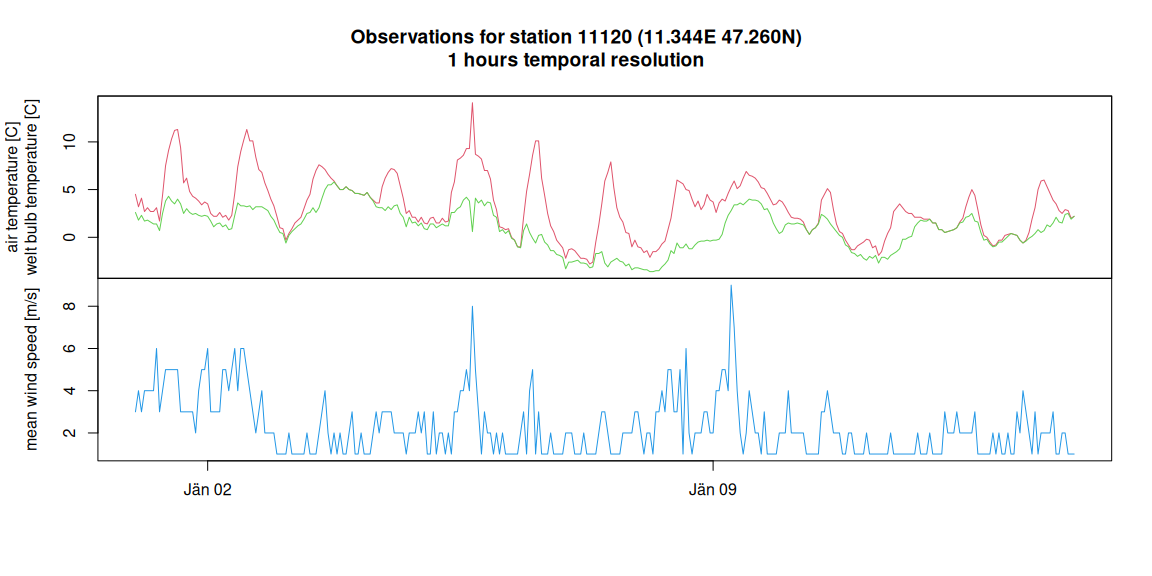
The following call to gs_stationdata() retrieves historical temperature,
dewpoint, and wind speed observations (synop; hourly data) for the first two
weeks of 2023 at Innsbruck Airport, station 11120.
When requesting data for a single station, gs_stationdata() returns a time
series object. For multiple stations, the function will return a named list of
time series objects.
library("gsdata")
innsbruck <- gs_stationdata(mode        = "historical",
                            resource_id = "synop-v1-1h",
                            start       = "2023-01-01",
                            end         = "2023-01-14",
                            parameters  = c("T", "Td", "ff"),
                            station_ids = 11120)
The default plotting method allows to easily visualize the data:
# Generic default plot
plot(innsbruck)

# Slightly modified plot
plot(innsbruck,
     screen = c(1, 1, 2),
     col    = c(2, 3, 4),
     ylab   = c("air temperature [C]\nwelt bulb temperature [C]",
                "mean wind speed [m/s]"))

Available data sets
As shown above, gs_stationdata() requires a mode, resource_id, station_ids, and (optional)
a list of parameters. The package provides a series of functions to list available
data sets as well as stations and parameters.
As demonstrated above, gs_stationdata() requires a mode, resource_id,
station_ids, and optionally a list of parameters when called. The package also offers
several functions to list available datasets, stations, and parameters.
Data sets
gs_datasets() returns a data.frame of available datasets from the GeoSphere Austria API.
By default, gs_dataset() uses type = "stations", limiting the results to station-related datasets.
ds <- gs_datasets()
head(ds, n = 3)
##      type       mode   resource_id data_format response_formats
## 1 station historical histalp-v1-1y     station      geojson|csv
## 2 station historical   klima-v1-1d     station      geojson|csv
## 3 station historical   klima-v1-1h     station      geojson|csv
##                                                                        url
## 1 https://dataset.api.hub.geosphere.at/v1/station/historical/histalp-v1-1y
## 2   https://dataset.api.hub.geosphere.at/v1/station/historical/klima-v1-1d
## 3   https://dataset.api.hub.geosphere.at/v1/station/historical/klima-v1-1h
In the object ds we can find the dataset used in the Innsbruck example above,
which provides the correct settings for mode and resource_id.
subset(ds, resource_id == "synop-v1-1h")
##       type       mode resource_id data_format response_formats
## 12 station historical synop-v1-1h     station      geojson|csv
##                                                                       url
## 12 https://dataset.api.hub.geosphere.at/v1/station/historical/synop-v1-1h
Station metadata
Once the appropriate mode and resource_id for the desired dataset are
identified, additional metadata can be retrieved using gs_metadata(). This
function returns a named list with all details provided by the API.
meta <- gs_metadata(mode = "historical", resource_id = "synop-v1-1h", type = "station")
names(meta)
##  [1] "title"            "parameters"       "frequency"        "type"             "mode"             "response_formats"
##  [7] "start_time"       "end_time"         "stations"         "id_type"
title: Title of the data set.frequency: Temporal resolution (observation frequency).start_time/end_time: Period for which this data set is available. Note that not all tations/parameters are available for the entire period!stations: List of all available stations.parameters: List of available parameters with description (German only).- …
Two of the most useful elements in the metadata are stations and parameters.
The parameters element is a data frame that includes the name (used when
retrieving data via the parameters argument in gs_stationdata()), a long name,
a German description, and the corresponding measurement units.
subset(meta$parameters, name %in% c("T", "Td", "ff"))
##    name           long_name                                                                   desc unit
## 39    T      Lufttemperatur                                                         Lufttemperatur   °C
## 40   Td  Taupunkttemperatur                       Taupunkt (bis 2001/06/19 tw. mit rel beschickt!)   °C
## 57   ff Windgeschwindigkeit Windgeschwindigkeit in 1/10 m/s (wird umgerechnet, wenn Knoten: *5.14)  m/s
The stations meta information is returned as a simple feature data.frame looking
as follows:
head(meta$stations)
## Simple feature collection with 6 features and 8 fields
## Geometry type: POINT
## Dimension:     XY
## Bounding box:  xmin: 9.848611 ymin: 47.1625 xmax: 15.36694 ymax: 48.69083
## Geodetic CRS:  WGS 84
##         type    id             name            state altitude valid_from   valid_to is_active
## 1 INDIVIDUAL 11330        MAYRHOFEN            Tirol      640 2007-08-28 2100-01-01      TRUE
## 2 INDIVIDUAL 11328       ACHENKIRCH            Tirol      904 1998-09-24 2016-10-04     FALSE
## 3 INDIVIDUAL 11375           AFLENZ       Steiermark      783 1992-10-08 2100-01-01      TRUE
## 4 INDIVIDUAL 11157 AIGEN IM ENNSTAL       Steiermark      641 1972-01-01 2100-01-01      TRUE
## 5 INDIVIDUAL 11301    ALBERSCHWENDE       Vorarlberg      715 1996-01-16 2100-01-01      TRUE
## 6 INDIVIDUAL 11019      ALLENTSTEIG Niederösterreich      599 1988-05-30 2100-01-01      TRUE
##                    geometry
## 1  POINT (11.85167 47.1625)
## 2 POINT (11.70528 47.53222)
## 3 POINT (15.24083 47.54583)
## 4 POINT (14.13833 47.53278)
## 5  POINT (9.848611 47.4575)
## 6 POINT (15.36694 48.69083)
Along with the id, the unique identifier used when calling gs_stationdata() via
on the station_ids argument, the API provides additional information about each
station. Since the stations are provided as a simple feature data frame, it is
easy to visualize their locations or search for specific stations of interest.
# Plotting altitude
plot(meta$stations["altitude"], pch = 19)

For more examples and a more comprehensive overview of all features of the gsdata package please
have a look at the documentation.
NEWS
R weather data meteorology climatology GeoSphere
